There are a few different ways to test the LA 610 for IMD.
My preferences lie with 19kHz/20kHz ITU-R and 60Hz/7kHz SMPTE IMD.
The idea behind tests like these is to see how the device will distort under complex signal conditions (like a music passage). In my opinion, this is a far more meaningful test for the LA 610 than THD+N, since it reveals performance behaviors that make music sound harsh and unpleasant.
This post will only address ITU-R IMD in the LA 610. ITU-R uses two equal amplitude high frequency tones that are spaced closely together. As I mentioned in the paragraph above, I use 19kHz and 20kHz tones for this particular test. These two tones will modulate each other, and the result is the creation of distortion products. We will be measuring the amplitude of distortion products in the LA 610 that appear at 1kHz, 18kHz, and 21kHz, and summing those harmonics together calculate our ITU-R distortion figure. Output level will be set to 0dBm.
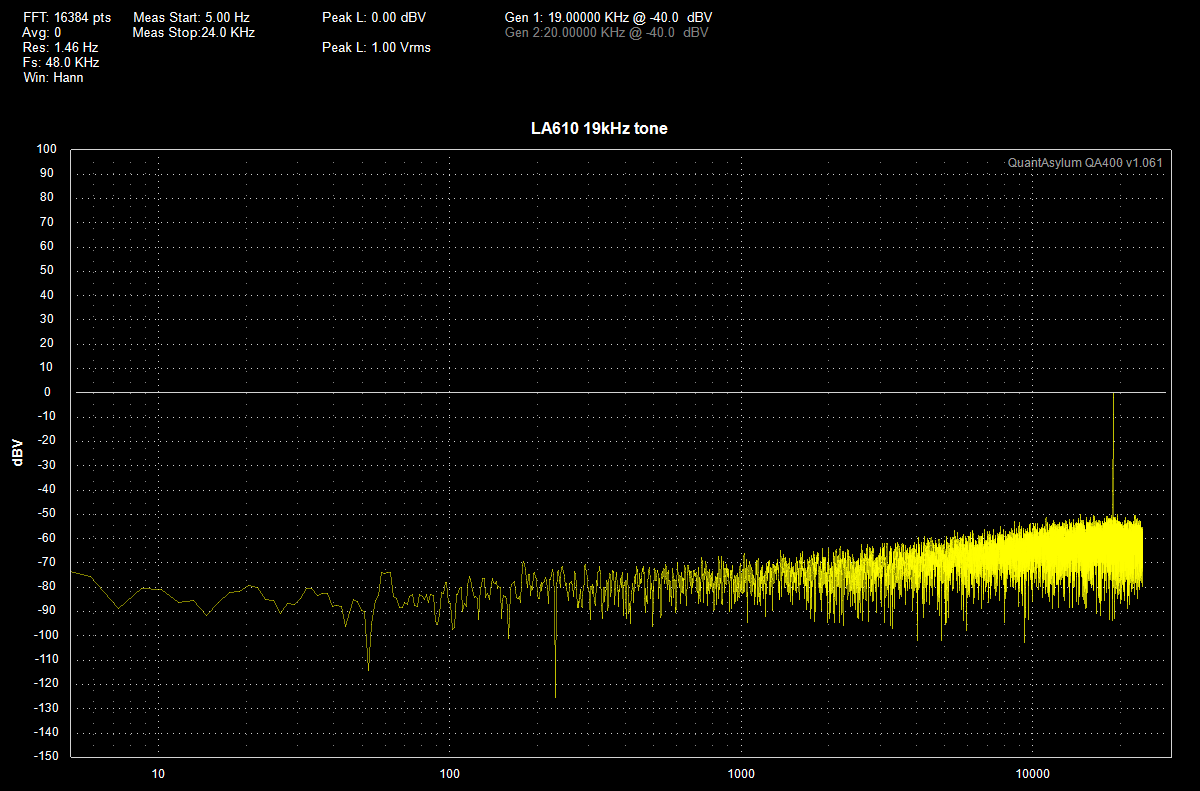
To start the test, I fed the LA 610 a 19kHz -40dBV tone. Preamp gain in this test is set to maximum, and output level is set to give a 0dBm output. You can see the Bode plot below. The tall spike seen on the right side of the graph is the 19kHz tone.
What happens when I feed the LA 610′s a 20kHz tone of equal amplitude? A few things. For one, notice how the amplitude of the two tones is suddenly dropped by an average of 5dB because of their influence on each other. Second, notice how there is also a 1kHz tone (at M4) that has appeared, and the newly created 1kHz product also has its own harmonic distortion components at 2kHz and 3kHz. Also notice how there is also a sort of ‘christmas tree’ of distortion harmonics surrounding the 19kHz and 20kHz tones at M0 and M4. Remember, we are only going to measure the amplitude of the 1kHz (M4) distortion, the 18kHz (M2) distortion, and the 21kHz (M3) distortion in relation to the 19kHz and 20kHz tones to achieve our ITU-R distortion figure, but it’s interesting to note what behavior occurs under our test conditions.
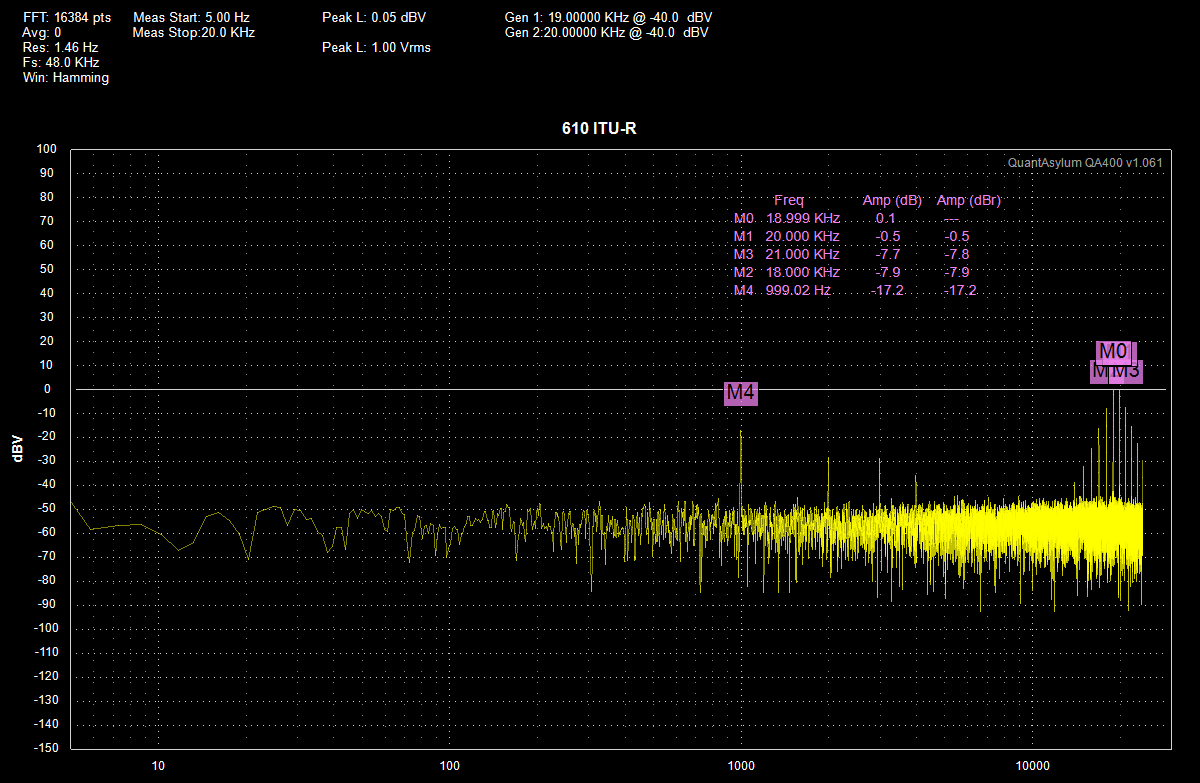
To obtain our distortion figure for this test, we sum the amplitude of the three distortion harmonics relative to the amplitude of the test tones. From the marker at M4 we can see that the 1kHz product is -17.2dB relative to the test tones, and the 18kHz and 21kHz products are -7.8 and -7.9dB. I use the average of the two 3rd harmonic tones (18kHz and 21kHz), which is -7.85dB. If we add this level to the 1kHz 2nd harmonic, we can see that the LA 610 has just under 43% ITU-R IMD at +0dBm.