have a product / project you’re interested in? or have something to say ?
la 610 THD+N tests
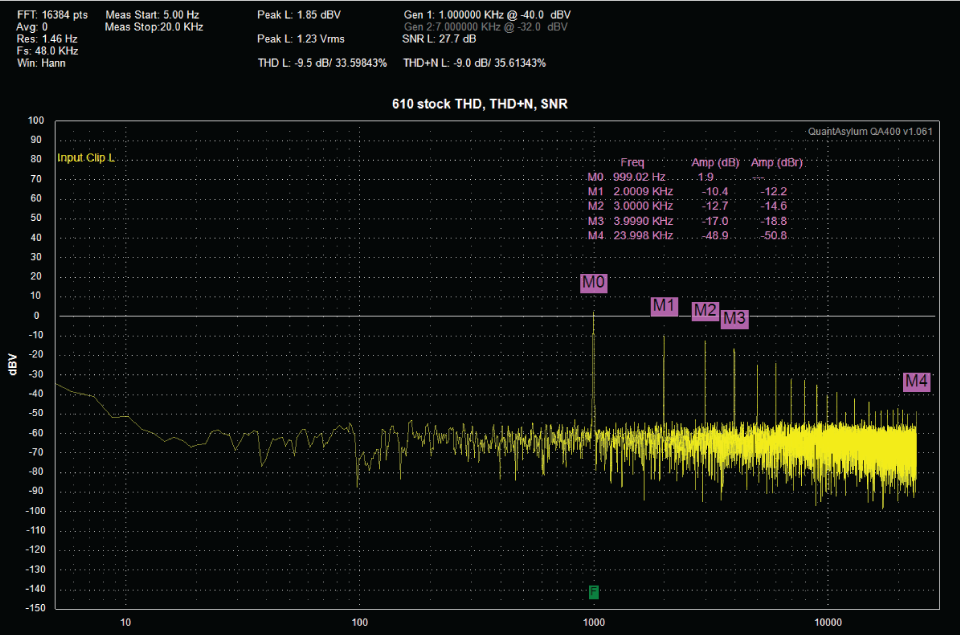
You can see the 1kHz fundamental whose amplitude is 1.23V, and you can see that the distortion behavior extends out from the 2nd, 3rd, 4th, 5th, and on to the 24th harmonic. THD+N makes up just over 35% of the signal, and SNR (Signal to Noise Ratio) is about 27 dB. For all intents and purposes, the device is behaving like an overdrive pedal in this test.
la 610 THD+N tests
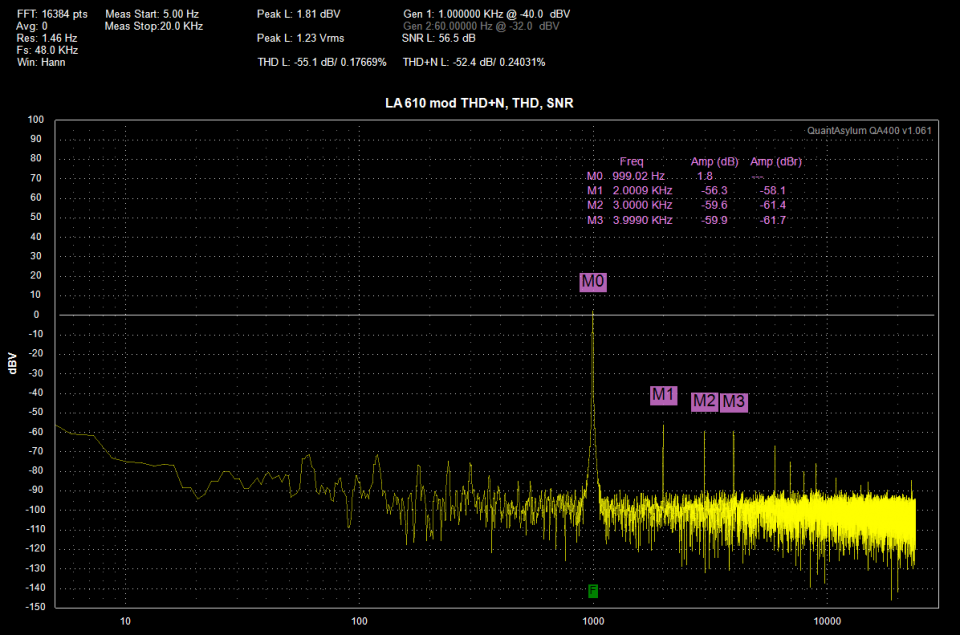
Again, you can see the 1kHz fundamental whose amplitude is 1.23V, and you can see its distortion behavior. THD+N makes up just over 0.24% of the signal, and SNR (Signal to Noise Ratio) is about 56 dB. As an aside–this isn’t the exact specified THD of the original LA2A, but it’s pretty close. (.35% @ +10dBm for the original vs .176% THD @ +4dBm here).